Graphs
To access this feature, the account you use to access the console must have the Access Advanced Telemetry permission assigned. See Understanding permissions.
To see the details for an IOA detection, open the Indicators of attack (IOA) list and select the IOA. See Accessing the lists. If the detection has a graph associated with it, the View attack graph button appears on the detection details page.
Graph structure
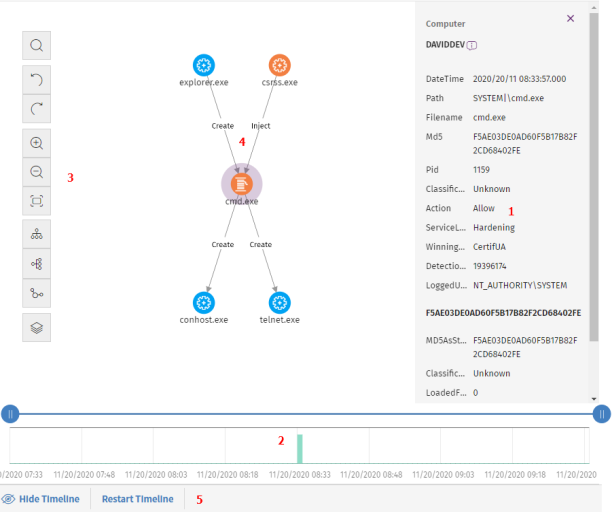
The following is a description of the information panels and tools available in a graph:
-
Information panel for the selected item (1): Shows information pertaining to the selected node or line. For more information about the meaning of the fields, see Format of the events contained in telemetry data.
-
Timeline (2): Shows a histogram with green bars that represent the events carried out by a threat. You can use the timeline to increase or reduce the displayed time period when the events occurred. For more information about how to use this resource, see Timeline.
-
Graph toolbar (3): Enables you to change the way the graph is shown on the page. See Graph settings.
-
Graph (4): A graphical representation of a set of events with nodes and arrows to show entities and the relationship between them. The numbers on the arrows indicate the order in which the events were recorded.
-
Timeline controls (5): Enable you to hide, show, or reset the timeline. See Timeline.
Graph settings
To modify the graph to your needs, use these resources:
-
The graph toolbar, on the left side of the page.
-
The context menus. To access them, right-click a node or a node group.
By default, the graph is displayed horizontally (6) with a sufficient level of zoom to make sure you can see all nodes without having to move the view.
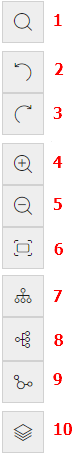
Graph toolbar
-
To highlight and find the nodes that match the search criteria you enter, click the (1) icon.
-
To undo the last action performed on the graph, click the (2) icon.
-
To redo the last action performed on the graph, click the (3) icon.
-
To zoom in the graph, click the (4) icon.
-
To zoom out from the graph, click the (5) icon.
-
To return to the default zoom setting, click the (6) icon.
-
To change the graph orientation to horizontal, click the (7) icon.
-
To change the graph orientation to vertical, click the (8) icon.
-
To change the graph orientation so that nodes are distributed freely taking advantage of the available space, click the (9) icon.
-
To show or hide information layers in the graph (10), see Hiding and showing layers.
Context menus
Right-click a node or node group to open its context menu. Options you cannot use based on the status of the node are disabled and appear dimmed.

Hiding and showing layers
To show or hide elements in the graph, click the (10) icon. A drop-down menu opens that shows these options:
-
Execution sequence: Hides or shows numbers on the events to determine the order in which events occurred. See Arrow styles.
-
Name of relationships: Hides or shows the names of the events. See Format of the events contained in telemetry data.
-
Name of entities.
Selecting nodes on the graph
-
To select a single node on the graph: Click the node.
-
To select multiple non-contiguous nodes on the graph: Press and hold the Ctrl or Shift key and click the nodes you want to select.
-
To select multiple contiguous nodes on the graph: Press and hold the Ctrl or Shift key, and click an empty area of the graph. Drag the mouse to draw a selection box that covers all the nodes you want to select.
When you select and right-click several nodes on the graph, the options that apply to all selected nodes show in the context menu.
Moving and deleting nodes
To move all nodes and lines on the graph:
Click an empty area of the graph. Drag the graph in the appropriate direction.
To move a single node:
Select the node and drag it to a new location. All lines that connect the node with its neighbors move and adjust themselves to the new location of the node.
To delete a single node using the keyboard:
-
Select the node you want to delete. Press the Delete key. A dialog box opens and shows the total number of nodes that will be deleted from the graph. This includes the selected node and its child nodes.
-
Click OK.
To delete a single node using the mouse:
-
Right-click the node you want to delete. The context menu opens.
-
Select Delete (x). A dialog box opens and shows the total number of nodes that will be deleted from the graph. This includes the selected node and its child nodes.
-
Click OK.
To delete multiple nodes:
-
Select the nodes you want to delete. Right-click one of the nodes. The context menu opens.
-
Select Delete (x). A dialog box opens and shows the total number of nodes that will be deleted from the graph. This includes the selected node and its child nodes.
-
Click OK.
Grouping nodes
With graphs that contain a large number of items, you can group nodes that are related to one another to simplify the graph.
Node groups can have two states:
-
Expanded: They show the nodes that make up the group.
-
Collapsed: They hide the nodes that make up the group.
A node group is an entity with these characteristics:
-
The actions taken on a node group affect all nodes that make up the group.
-
You can group nodes of different types.
-
When you delete a group, you delete all nodes that make up the group from the graph.
-
When you collapse a group, all relationships between the nodes in the group and external nodes are represented as if they were established with the group. Arrows that indicate relationships of the same type (same type of event) are also grouped (see Information about collapsed groups).
-
The empty area of an expanded group represents the set of nodes in the group. For example, to open the context menu for all nodes in a group, right-click an empty area of the expanded group. Likewise, if you select Delete, you will delete all nodes in the group.
-
A node belonging to an expanded group behaves in the same way as a node that is not in a group: you can move it individually, open its context menu, delete it, etc.
-
A group can consist of nodes only, other groups only, or a combination of nodes and groups.
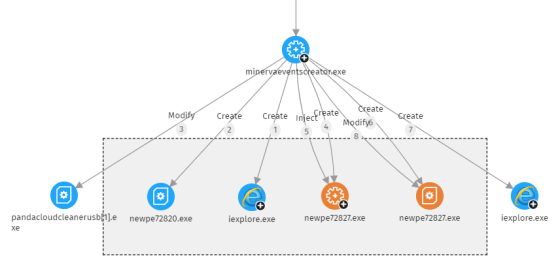
To group a set of nodes:
-
Select multiple nodes on the graph. Right-click one of the nodes. A context menu opens.
-
From the menu, select Group
. A rectangle appears that contains all nodes in the group.
-
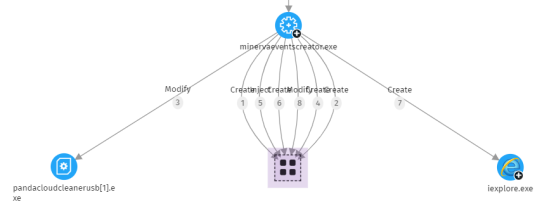
Right-click an empty area of the rectangle. The context menu for the group opens.
-
From the menu, select Collapse
. The grouped nodes are replaced with a small square and all relationships with the nodes in the group point to the square.
To expand a collapsed node group:
-
Right-click the collapsed node group. A context menu opens.
-
Select Expand
. The previously collapsed nodes appear in the rectangle.
To ungroup nodes:
-
Right-click the node group. A context menu opens.
-
Select Ungroup
. The nodes reappear on the graph and the rectangle disappears.
Information about collapsed groups
Types of grouped nodes
A node group can contain nodes classified as goodware, malware, or unclassified. This is indicated by the group color.
| Color | Description |
|---|---|
|
|
Group with blocked items. |
|
|
Group with items classified as goodware. |
Number of grouped nodes
In the upper-left corner, you can see the number of nodes that would appear on the graph if the group were not collapsed. This number does not have anything to do with the total number of nodes (parent nodes, child nodes, etc.) the group can contain. It shows only the number of nodes that were visible prior to being collapsed.
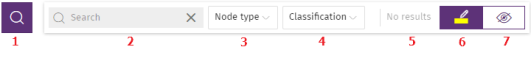
Searching for nodes
The search bar enables you to highlight nodes of interest and access their details quickly.
-
(1): Click to show or hide the search bar.
-
(2): Type the character string you want to search for. The search runs in real time on the names and details of nodes only. The content of arrows is excluded from searches. To clear the search, click the
icon.
To avoid showing orphan nodes in search results, the parent node is always included, even if it does not match the entered pattern.
-
(3): Restricts searches on graphs to certain types of entities. To extend searches to include more than one type of entity, expand the drop-down menu and select the types of entities that you want to search for. To search across all types of entities again, click Clear search. The logical operator that is applied when you run a search across multiple types of entities is OR.
-
(4) Restricts searches on graphs to the entities that have been classified by Advanced EDR as the value you select in the drop-down menu. To extend searches to include more than one type of classification, expand the drop-down menu and select the types of classifications that you want to search for. To run a new search ignoring the classification of entities, click Clear search. The logical operator that is applied when you run a search across nodes with different classifications is OR.
-
The logical operator that is applied when you run a search by entity and by classification simultaneously is AND.
-
(5): Indicates the number of nodes that match the search pattern entered. If the highlighting tool is enabled (4) and you click the
icon, a drop-down menu appears:
-
Select found nodes: Selects the nodes that match the search pattern entered. To show the context menu, right-click any of the selected items.
-
Select all nodes except found nodes: Selects nodes that do not match the search pattern entered. To show the context menu, right-click any of the selected items.
-
-
(6): Highlights found items in yellow.
-
(7): Hides items that do not match the search pattern entered.
The searches you run on nodes belonging to an expanded group behave in the aforementioned way. However, with nodes in a collapsed group, they behave differently:
-
If the search is performed with the highlighting tool enabled (6), the group is highlighted if any of the nodes in the group match the search criteria. Otherwise, the group is not highlighted.
-
If the search is performed with the hiding tool enabled (7), the group is shown if at least one of the nodes in the group matches the search criteria. Otherwise, the group is not shown on the graph.
Timeline
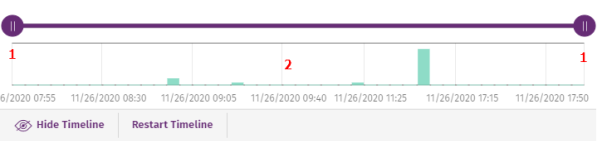
You can blur the nodes and relationships that occurred outside a selected time range. This way, you can concentrate on the data that is more relevant to you.
The timeline includes a histogram with green bars (2) that represent the events carried out by a threat. Point to the bars to show a tooltip of the number of events and the date they were logged.
To select a specific interval on the timeline:
-
Click (1) and drag it to the left or right. The histogram is expanded or reduced to fit the new interval.
-
The graph shows the events and nodes that occurred within the interval. Other events and nodes are blurred.
To hide/show the timeline:
-
To hide the panel, click Hide timeline.
-
To show it again, click Show timeline.
-
Click Reset timeline to return the timeline to its default settings.
Information contained in graphs
Graphs provide a graphical representation of the execution tree of an IOA detection, where nodes represent the entities that participate in an operation (such as processes, files, or communication or operation targets) and arrows represent operations. Graphs use color codes, panels, and other resources that provide information about the represented entities and their relationships.
The resources used to present this information are:
-
Node colors: Indicate the item classification.
-
Node icons: Indicate the item type.
-
Status icons: Indicate the action taken on the item.
-
Arrow colors: Indicate whether the item was blocked or allowed.
-
Arrow styles: Indicate the number and direction of the actions executed between the nodes.
-
Arrow labels: When you click the label of an arrow, the right panel shows information about the action taken by the process.
-
Node labels: When you click the label of a node, the right panel shows information about the entity.
Node colors
| Color | Description |
|---|---|
|
|
Item classified as malware. |
|
|
|
|
(Original color) |
Item classified as goodware. |
Node icons
| Icon | Description | Icon | Description |
|---|---|---|---|
|
|
Process. If it belongs to a known software package, the icon is shown. |
|
Compressed file |
|
|
Remote thread |
|
Executable file |
|
|
Library |
|
Script file |
|
|
Protection |
|
Windows registry branch value |
|
|
Folder |
|
URL used in a communication |
|
|
Non-executable file |
|
|
Status icons
| Icon | Description | Icon | Description |
|---|---|---|---|
|
|
File deleted |
|
File quarantined |
|
|
File disinfected |
|
Process deleted |
Node labels
They indicate the name of the entity. When you click the label of a node, an information panel appears on the right side of the page. This panel shows a number of fields that describe the entity.
Arrow colors
The color of the arrows indicates whether Advanced EDR or Advanced EDR allowed the action or blocked it because the process was classified as a threat.
-
Red: The action was blocked. See the meaning of the actions in the action field in Format of the events contained in telemetry data.
-
Black: The action was allowed.
Arrow styles
-
Arrow thickness: Represents the number of times the same type of action was executed between two nodes. The greater the number of actions, the thicker the arrow. When you click an arrow, the information panel shows the dates when the first and last actions in the group occurred.
-
Arrow direction: Indicates the direction of the action.
-
Numbers: The numbers on the arrows indicate the order in which the event was recorded.
Arrow labels
They indicate the name of the action taken by the process. When you click the label of an arrow, the information panel shows a number of fields that describe the event that occurred.
Node levels shown by default
By default, the graph is displayed horizontally with the node that triggered the IOA detection at the center of the graph. It is surrounded by a subset of nodes related to the detection:
-
Three node levels above the main node: The graph shows parent, grandparent, and great-grandparent nodes of the main node.
-
One node level below the main node: The graph shows child nodes of the main node.
The graph can show up to a maximum of 25 nodes at the same level. When there are more than 25 nodes, the graph shows no nodes to avoid overloading graphs.
Showing child nodes
The ![]() icon in the bottom-left corner of a node indicates that the node has hidden child nodes. To show its child nodes, right-click the node. A context menu opens. Select one of the available options:
icon in the bottom-left corner of a node indicates that the node has hidden child nodes. To show its child nodes, right-click the node. A context menu opens. Select one of the available options:
-
Show parent: Shows the parent nodes of the selected node.
-
Show all activity (number): Shows all the child nodes of the node regardless of the type. The maximum number of nodes shown is 25. The total number of events that link the parent node with the child node shows.
-
Show children: Opens a drop-down list. Select the type of child nodes to show and select the number of nodes for each type. The types of nodes include:
-
Data files: Files with unidentified information.
-
Script files: Files with command sequences.
-
Downloads: Data files downloaded from the Internet/network.
-
DNS: Domains that failed to resolve the IP.
-
Windows registry entries
-
Compressed files
-
PE files: Executable files.
-
Remote threads
-
IPs: IP addresses for either end of the communication.
-
Libraries
-
Processes
-
Protection: Action taken by the antivirus.
-
When you select and right-click several nodes on the graph, the options that apply to all selected nodes show in the context menu.