Indicators of Attack module panels/widgets
From the top menu, select Status. From the side menu, select Indicators of attack (IOA).
Required permissions
| Permissions | Access to widgets |
|---|---|
|
View detections and threats |
|
All widgets, except Threat Hunting Service, show only information generated by the computers on the network that are visible to the role associated with the administrator account used to access the console.
Advanced EDR shows detections with the Pending status in widgets when it detects suspicious activities on the customer network. See Introduction to IOA concepts.
For more information about the IOA detection grouping strategies implemented in Advanced EDR, see Groups of IOA-generated detections.
Threat Hunting Service
This widget shows a summary of the events, indicators, and IOAs for all computers and devices on the network, for a selected time, to help you determine if there are intrusion attempts.
Indicators of attack with the Deleted status are not included in the Threat Hunting Service widget.

Meaning of the data displayed
| Data | Description |
|---|---|
|
Events |
Number of actions carried out by programs installed on protected computers and monitored by Advanced EDR. These events are received as part of the telemetry and are stored on the Cytomic platform to look for suspicious behavior patterns. This counter includes all detections on the network, regardless of the visibility assigned to the account that accesses the Advanced EDR console. |
|
Indicators |
Number of suspicious event patterns detected in the event data flow. This counter includes all detections on the network, regardless of the visibility assigned to the account that accesses the Advanced EDR console. |
|
Indicators of attack (IOA) |
Number of indicators that are highly likely to be an attack. |
|
Computers in RDP attack containment mode |
Number of computers that experienced an attack through the RDP protocol and are in RDP attack containment mode. |
Lists accessible from the panel

Click the hotspots shown in Hotspots in the Threat Hunting Service panel to open these lists with these predefined filters:
| Hotspot | List | Filter |
|---|---|---|
|
(1) |
Indicators of attack (IOA) |
No filter. |
|
(2) |
Computer protection status |
“RDP attack containment” mode = Yes |
Detections trend
This widget includes a line and bar graph that shows the number of indicators, pending IOA detections, and archived IOA detections over time.
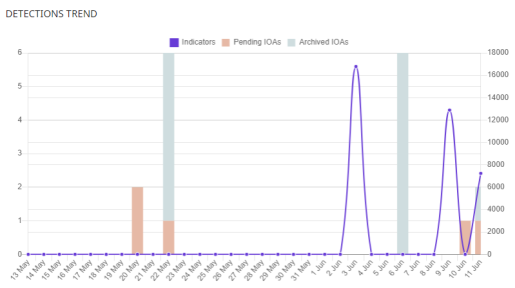
To represent the different scales in the same diagram, the graph has two Y-axes:
-
The Y-axis on the left measures recorded pending and archived detections.
-
The Y-axis on the right measures indicators detected.
Meaning of the data displayed
| Data | Description |
|---|---|
|
Indicators |
Number of suspicious patterns detected in the event flow received. |
|
Pending IOAs |
Number of suspicious patterns that are highly likely to indicate an attack. An administrator has not analyzed or resolved the IOA. |
|
Archived IOAs |
Number of IOAs that an administrator has analyzed or resolved and marked as Archived. |
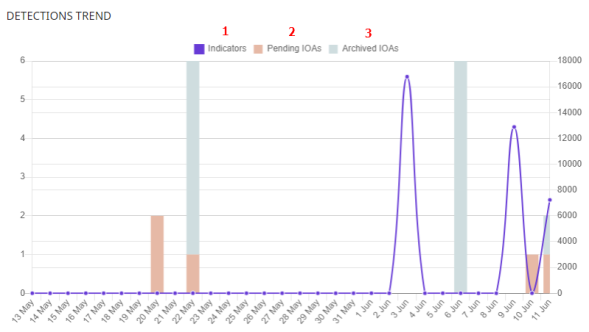
Click the hotspots shown in Hotspots in the Detections Trend panel to open the Indicators of attack (IOA) list with these predefined filters:
| Hotspot | Filter |
|---|---|
|
(1) |
None |
|
(2) |
Status = Pending |
|
(3) |
Status = Archived |
Indicators of attack (IOA) mapped to the MITRE ATT&CK matrix
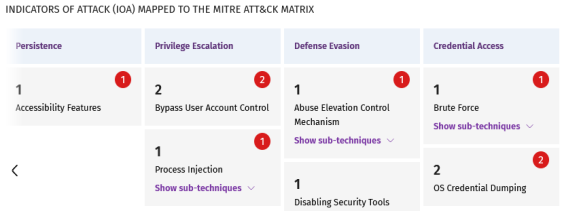
This widget shows a table of the number of IOAs detected during the selected time period, arranged by MITRE tactic and technique.
Point to a box to view:
-
The name and code of the tactic/technique
-
The total number of detections
-
The number of pending detections
An IOA detection has at least one tactic and one technique associated with it. However, not all IOA detections have sub-techniques associated with them.
To view the sub-techniques associated with an IOA detection, click Show sub-techniques.
Indicators of attack with the Deleted status are not included in the MITRE ATT&CK widget.
Meaning of the data displayed
| Data | Description |
|---|---|
|
Red number |
Number of detections recorded, with Pending status, which use the specified tactic, technique, and sub-technique. |
|
Black number |
Total number of recorded detections (pending + archived) that use the specified tactic, technique, and sub-technique. |
|
Show sub-techniques link |
Shows the sub-techniques associated with the IOA. For each sub-technique, the panel shows the total number of pending detections (in red) or pending and archived detections (in black) that have that sub-technique associated with them. |
Lists accessible from the panel
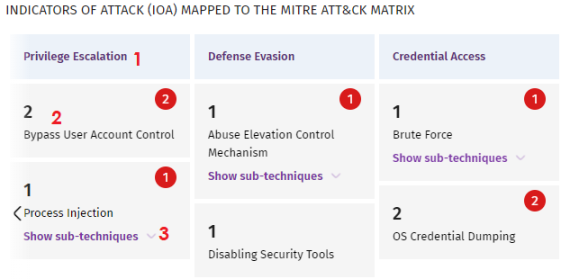
Click the hotspots shown in Hotspots in the Indicators of Attack (IOA) Mapped to the MITRE ATT&CK Matrix panel to open the Indicators of attack (IOA) list with these predefined filters:
| Hotspot | Filter |
|---|---|
|
(1) |
|
|
(2) |
|
|
(3) |
Sub-technique = The sub-technique selected in the widget |
Detected indicators of attack (IOA)
This widget shows the distribution of IOA detections by type recorded during the selected time period. The greater the number of detections of a particular type, the larger the box within the widget.
Indicators of attack with the Deleted status are not included in the Detected Indicators of Attack (IOA) widget.
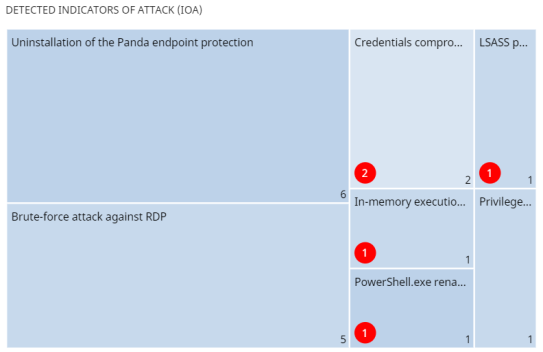
Meaning of the data displayed
| Data | Description |
|---|---|
|
Red number |
Number of pending detections of a given type recorded during the selected period. |
|
White number |
Total number of recorded detections (pending + archived) of a given type recorded during the selected period. |
Lists accessible from the panel
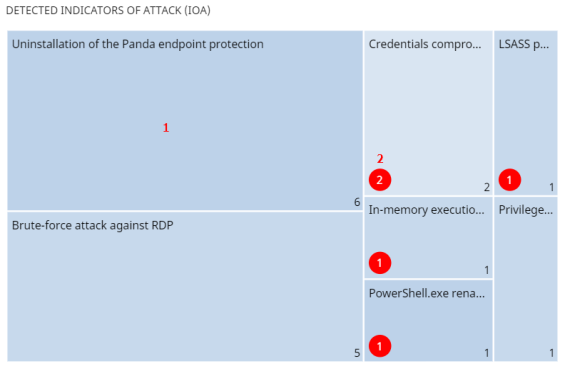
Click the hotspots shown in Hotspots in the Detected Indicators of Attack (IOA) panel to open the Indicators of attack (IOA) list with these predefined filters:
| Hotspot | Filter |
|---|---|
|
(1) |
Indicator of attack = The indicator of attack selected in the widget |
|
(2) |
|
Indicators of attack (IOA) by computer
This widget shows the distribution of detections for each computer on the network during the time period. The greater the number of detections on a particular computer, the larger the box within the widget.
Indicators of attack with the Deleted status are not included in the Indicators of Attack (IOA) by Computer widget.
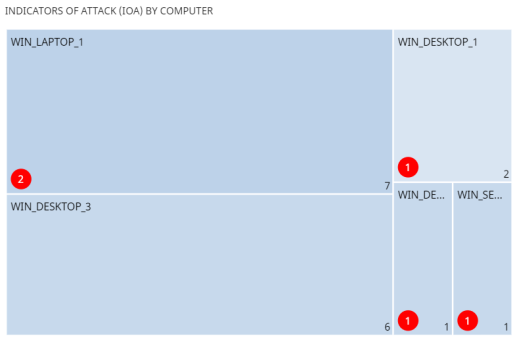
Meaning of the data displayed
| Data | Description |
|---|---|
|
Red number |
Number of pending detections recorded on a specific computer during the selected period. |
|
White number |
Total number of recorded detections (pending + archived) on a specific computer during the selected period. |
Lists accessible from the panel

Click the hotspots shown in Hotspots in the Indicators of Attack (IOA) by Computer panel to open the Indicators of attack (IOA) list with these predefined filters:
| Hotspot | Filter |
|---|---|
|
(1) |
Computer |
|
(2) |
|