Status area overview
The Status menu includes the main visualization tools and is divided into several sections:
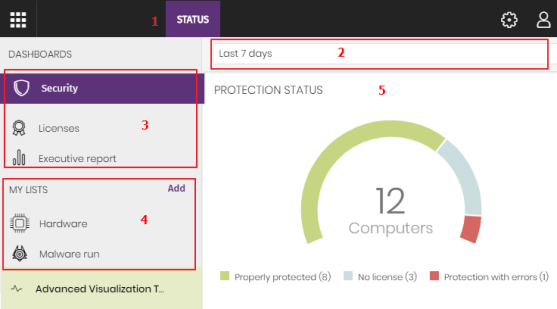
Access to dashboards (1)
The Status menu at the top of the page gives access to various types of dashboards. From here you can also access different widgets, as well as lists.
The widgets represent specific aspects of the managed network, while more detailed information is available through the lists.
Time period selector (2)
The dashboard shows information for the time period selected by the administrator in the drop-down menu at the top of the Status page. You can select the following time periods:
-
Last 24 hours
-
Last 7 days.
-
Last month.
-
Last year.
Some widgets do not show information for the last year. If last year information is not available for a specific widget, a notification is displayed.
Dashboard selector (3)
-
Security: Information about the security status of the IT network. For more information about the available widgets, see Security module panels/widgets.
-
Cytomic Patch: Information about updates of the operating system and third-party software installed on computers. For more information about the available widgets, see Security module panels/widgets.
-
Cytomic Data Watch: Information about the monitoring of the personal data stored on the computers on your network. For more information about the available widgets, see Introduction to Cytomic Data Watch operation.
-
Cytomic Encryption: Information about the encryption status of your computers’ internal storage devices. For more information about the available widgets, see Security module panels/widgets.
-
Licenses: Information about the status of the Advanced EDR licenses assigned to the computers on your network. See Licenses for more information about license management.
-
Scheduled reports: See Scheduled sending of reports and lists for more information about how to configure and generate reports.
My lists (4)
The lists are data tables with the information presented in the widgets. They include highly detailed information and have search and filter tools to locate the information you need.
Information panels/widgets (5)
Each dashboard has a series of widgets related to specific aspects of network security.
The information in the widgets is generated in real time and is interactive: Point the mouse to an item in a widget to display a tooltip with more detailed information.
All the graphs include a legend explaining the meaning of the data displayed and have hotspots that can be clicked on to show lists with predefined filters.
Advanced EDR uses several types of graphs to display information in the most practical way based on the type of data shown:
-
Pie charts.
-
Histograms.
-
Line charts.