Risk assessment module panels/widgets
Accessing the dashboard
To access the dashboard, select the Status menu at the top of the console. Select Risks from the side menu.
Company risk
Shows the number of computers that have one of the set levels of risk from all computers that are visible to you. The status of computers is depicted by a circle with various colors and associated counters. The panel shows the number and percentage of computers with the same status.
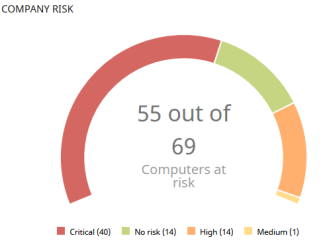
Meaning of the data displayed
| Data | Description |
|---|---|
|
Critical |
Number of computers that have a critical risk level. |
|
High |
Number of computers that have a high risk level. |
|
Medium |
Number of computers that have a medium risk level. |
|
No risk |
Number of computers that are not at risk. |
|
Central area |
Sum of all computers that have some level of risk. |
Lists accessible from the panel
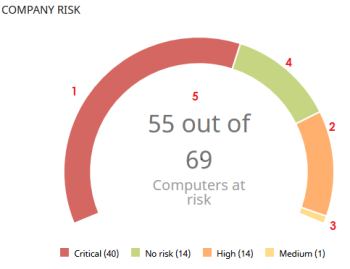
Click the hotspots shown in Hotspots in the Company risk panel to open the Risks by computer list with the following predefined filters:
| Hotspot | Filter |
|---|---|
|
(1) |
Risk = High |
|
(2) |
Risk = Critical |
|
(3) |
Risk = No risk |
|
(4) |
Risk = Medium |
|
(5) |
No filters |
Risks trend
Shows the trend of the number of computers that have a specific risk level over time.
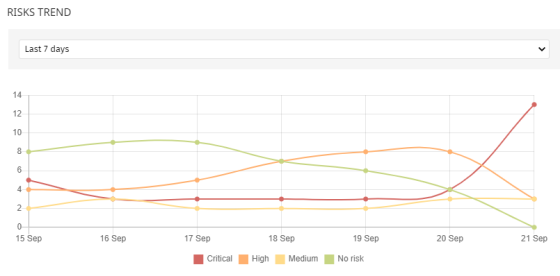
Meaning of the data displayed
| Data | Description |
|---|---|
|
Critical risk |
Trend of the number of computers that have a critical risk level. |
|
High risk |
Trend of the number of computers that have a high risk level. |
|
Medium risk |
Trend of the number of computers that have a medium risk level. |
|
No risk |
Trend of the number of computers that have no risks. |
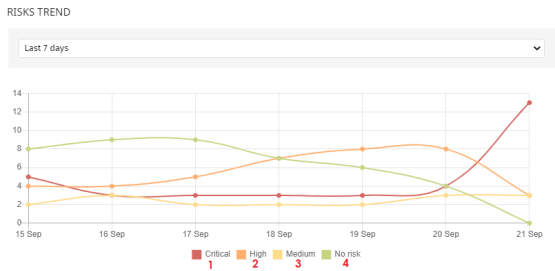
Point the mouse to a node on the graph to show a label with the following information:
-
Date
-
Risk level
-
Number of computers
Lists accessible from the panel
Click the legend items under the graph to open the Risks by computer list filtered to show the selected item. To view the Risks by computer full list with no filters applied, click an empty space on the graph.
| Hotspot | Filter |
|---|---|
|
(1) |
Risk = Critical |
|
(2) |
Risk = High |
|
(3) |
Risk = Medium |
|
(4) |
No risks |
Detected risks
Shows a list of the risks most detected on computers.
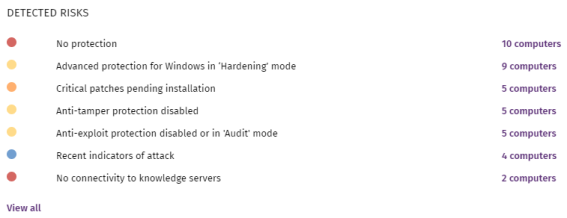
Meaning of the data displayed
| Data | Description |
|---|---|
|
Icon |
Risk level defined by you.
|
|
Name |
Risk name. |
|
Number |
Number of computers where the risk was detected. |
|
View all |
Link to the full list of detected risks. |
Lists accessible from the panel
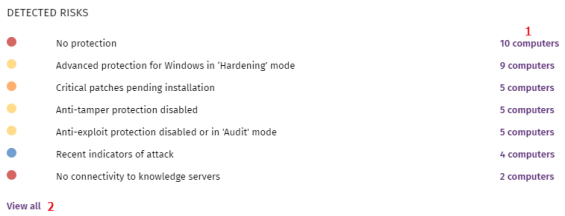
Click the hotspots shown in the figure to open lists with the following predefined filters:
| Hotspot | List | Filter |
|---|---|---|
|
(3) |
Risks by computer |
Detected risk = Risk selected on the widget |
|
(4) |
Risks |
No filters |
Top 10 computers at risk
Shows the ten computers with the highest overall risk level.
![]()
The overall risk level for a computer is equal to the highest risk level for any risk detected on the computer. For more information, see Calculation of the overall risk level assigned to each computer.
Meaning of the data displayed
| Data | Description |
|---|---|
|
Name |
Computer or device name and type. |
|
Color bar |
Risk distribution graph for the computer. |
|
Risk level |
Overall risk level assigned to the computer. |
|
View all link |
Access to the Risks by computer full list. |
Lists accessible from the panel
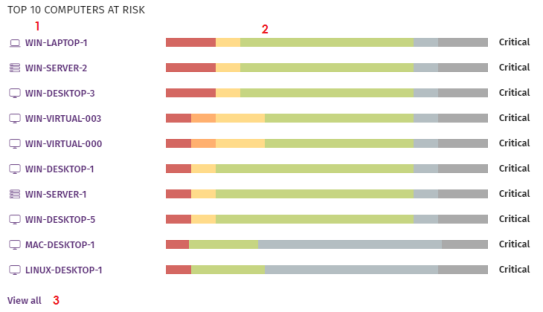
Click the hotspots shown in the figure to open lists with the following predefined filters:
| Hotspot | List | Filter |
|---|---|---|
|
(1) |
Computer details |
|
|
(2) |
Risks |
Computer selected on the widget. |
|
(3) |
Risks by computer |
No filters |
You can also find information about the status of the risks detected on a computer on the Computer details page. For more information, see Computer details.