Execution graphs
Advanced EDR shows a graph with the telemetry collected in the last 15 days for each detection made by the advanced protection. This graph provides a graphical representation of the actions taken by the programs involved in an attack.
To view the execution graph for a threat, access its details page (see Details of blocked programs). Select the Activity tab. Click the View activity graph button.
-
Select the Malware and PUP activity list to open the Malware detection page.
-
Select the Exploit activity list to open the Exploit detection page.
-
Select the Currently blocked programs being classified list to open the Blocked program details page.
-
Select the Blocks by advanced security policies list to open the Block by advanced security policy page.
Select the Activity tab. Click View activity graph to view a threat execution graph.
Execution graphs offer a graphical representation of the information shown in the action tables, emphasizing the time aspect. They provide an at-a-glance idea of the actions triggered by a threat.
Diagrams
Execution graphs represent the actions taken by threats with two items:
-
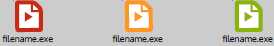
Nodes: They mostly represent actions or information items.
-
Arrows: They connect the action and information nodes to establish a timeline, and assign each node the role of “subject” or “predicate”.
Nodes
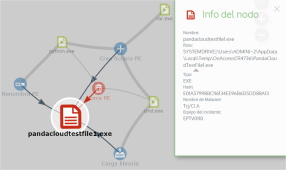
Nodes show information through their associated icon, color, and description panel on the right of the page when you select them.
The color code used is as follows:
-
Red: Untrusted item, malware, threat.
-
Orange: Unknown/unclassified item.
-
Green: Trusted item, goodware.
Graphical representation of malware actions in an execution graph shows action-type nodes along with a brief description:
| Symbol | Description | Symbol | Description |
|---|---|---|---|
|
|
File downloaded. Compressed file created. |
|
Executable file deleted. |
|
|
Socket/communication used. |
|
Library loaded. |
|
|
Monitoring initiated. |
|
Service installed. |
|
|
Process created. |
|
Executable file renamed. |
|
|
Executable file created. Library created. Registry key created. |
|
Process stopped or closed. |
|
|
Executable file modified. Registry key modified. |
|
Thread created remotely. |
|
|
Executable file mapped for write access. |
|
Compressed file opened. |


Graphical representation of description-type nodes in an execution graph shows description-type nodes along with a brief description:


Arrows
The arrows of the graphs connect the different nodes and help establish the order in which the actions performed by a threat were executed.
The two attributes of an arrow are:
-
Thickness: The thickness of the arrow represents the number of times the same type of action was executed between two nodes. The greater the number of actions, the thicker the arrow.
-
Direction: The direction of the arrow indicates the direction of the action.
Timeline
The timeline helps control the display of the string of events carried out by a threat over time. The controls at the bottom of the timeline enable you to position the view at the precise moment when the threat carried out an action and retrieve extended information that can help you complete a forensic analysis.
To select a specific interval on the timeline, drag the gray interval selectors to the left or right.
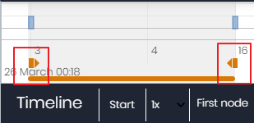
After selecting a timeframe, the graph shows the events and nodes that occurred within the interval. Other events and nodes are blurred.
The actions carried out by a threat are represented on the timeline as vertical bars accompanied by a timestamp, which indicates the hour and minute when they occurred.
To view the string of actions taken by a threat, use the following controls:
![]()
-
Start: Starts the timeline at a constant speed of 1x. The graphs and lines representing the actions appear while display as the timeline progresses.
-
1x: Sets the speed of the timeline.
-
Stop: Stops the progress of the timeline.
-
+ and -: Zooms in and zooms out of the timeline.
-
< and >: Select the previous or subsequent node.
-
Initial zoom: Restores the initial zoom level if you zoomed in or out with the + and – buttons.
-
Select all nodes: Moves the time selectors to cover the whole timeline.
-
First node: Sets the time interval to the start of the timeline.
To see the full path of the timeline, select "First node”. Then, click “Start”. To set the travel speed, click 1x and select a speed option.
Filters
The controls for filtering the information shown on an execution graph are at the top of the graph.
-
Action: Use the drop-down menu to select an action type from all those executed by the threat. The graph shows only the nodes that match the action type selected and the adjacent nodes associated with this action.
-
Entity: Use the drop-down menu to choose an entity (the content of the Path/URL/Registry Key/IP:Port field).
Node movement and general zoom
To move a graph in the four directions (up, down, left, right) and zoom in or zoom out, you can use the controls in the upper-right corner of the graph.
To zoom in and zoom out more easily, you can use the mouse wheel.
-
Click the
 symbol to leave the graph view.
 -
To hide the timeline button zone in order to leave more space on the page for a graph, click the
 icon located in the lower-right corner of the graph.
 -
Finally, you can configure the behavior of a graph through the panel shown when you click the
 button in the upper-left corner of the graph.