Indicators of Compromise (IOCs) dashboard/widgets
To access the Indicators of Compromise (IOCs) dashboard, your user account role must have the Search for and manage IOCs permission assigned. See Understanding permissions.
To view IOC detections on the network you manage:
-
From the top menu, select Status.
-
From the side menu, select IOCs. The IOCs dashboard opens with a number of widgets.
-
From the drop-down menu at the top of the dashboard, select a time period for the data shown:
-
Last 24 hours
-
Last 7 days
-
Last month
-
Last 3 months
-
For more information about each widget, see:
Last IOC search tasks
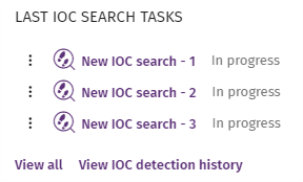
This widget shows a list of the most recent IOC search tasks created. This widget includes several links that enable you to manage IOC search tasks on a customer network:
-
Click a task to edit its settings.
-
Click the View all link to go to the list of IOC tasks.
-
Click View IOC detection history to access the Detected IOCs list with all completed detection tasks (failed and successful).
-
Click the context menu icon in each task to see the task results.
Most detected IOCs
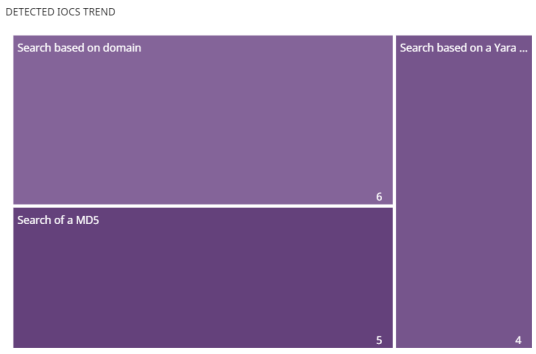
This widget shows a graph with the IOCs detected on the computers on the network during the selected time period. The results are presented in a treemap chart.
Meaning of the data displayed
| Data | Description |
|---|---|
|
IOC name |
Detected IOC name. The size of the rectangle is proportionate to the number of times that the specific IOC was detected as a percentage of all IOCs detected on the network. |
|
Number of detections |
Number of computers on which each IOC was found. Search tasks identify an IOC once only on each computer. |
Lists accessible from the panel
Click the rectangles shown in figure Last IOC Search Tasks widget to open the Detected IOCs list filtered by the selected IOC.
Detected IOCs trend
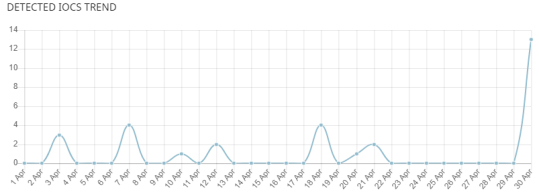
This widget shows a line graph of the number of IOCs detected over a period of time.
Meaning of the data displayed
| Data | Description |
|---|---|
|
Data |
Graphical representation of the number of IOC detections. |
|
Y axis |
Number of IOCs detected. |
|
X axis |
Date of the IOC detections. |
Lists accessible from the panel
To open the Detected IOCs list filtered to show IOCs for the selected date, click a data point on the graph.