Investigations List
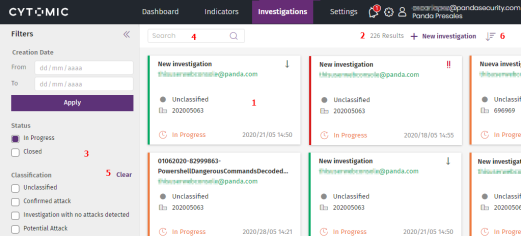
The Investigations list page is divided into multiple sections:
-
Investigations panel (1): Contains a number of tiles, each corresponding to a previously created investigation. For more information about the details shown in each tile, see Format of an Investigation Tile.
-
Filter panel (3): Helps analysts find investigations. See Filter Investigations.
-
Search (4): Find investigations by their name. See Search for Investigations.
-
Sort list (6): Shows the list of investigations according to the sort order you select.
-
New investigation (2): Shows the wizard for creating a new investigation. See Create an Investigation
Format of an Investigation Tile
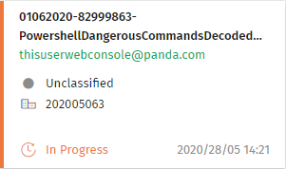
For each investigation, a tile is shown with this information:
-
Name (1): Cytomic Orion sets the default name ‘New investigation’.
-
User (2): User account assigned to the investigation. This name appears in green if it matches the user account with which you accessed the console. Otherwise, it appears in gray.
-
Classification (3): Indicates the investigation classification:
-
Unclassified
: The investigation is pending analysis.
-
Confirmed attack
: The indicator investigation resulted in the detection of an attack.
-
Investigation without detected attacks
: The indicator investigation did not find any attacks.
-
Potential attack
: The indicator investigation is inconclusive, but the indicators have a high probability of being an attack.
-
-
Clients (4): Names of the clients assigned to the investigation. If the account with which you accessed the web console does not have sufficient permissions, only the identifiers are shown.
-
Status (5):
-
In progress: The investigation remains open.
-
Closed: The investigation has been closed. The tile is grayed out.
-
-
Start date (6): Date and time the investigation was created
-
Priority: The investigation priority is indicated with a color in the border of the tile and an icon in the upper-right corner.
-
Critical
: The risk level of the investigated indicators is very high. The color is red.
-
High
: The risk level of the investigated indicators is high. The color is orange.
-
Medium: The risk level of the investigated indicators is medium. The color is green.
-
Low
: The risk level of the investigated indicators is low. The color is gray.
-