MITRE Dashboard
This dashboard provides information about the detected signals, grouped by the tactics and techniques classified in the MITRE ATT&CK matrix.
To access the dashboard:
-
In the top menu, select Dashboard. From the side panel, select MITRE. A page opens that shows the dashboard tiles.
-
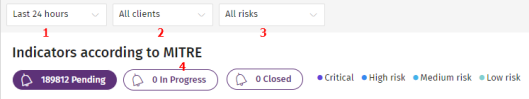
Select a time period for the data shown in the tiles (1):
-
Last 24 hours
-
Last 7 days
-
Last month
-
-
Select the client for which signals are shown (2)
-
All clients: Shows signals for all clients.
-
Client ID: Shows signals for the selected client.
-
-
Select the risk level for the techniques and tactics shown on the page (3):
-
All risks
-
Critical
-
High risk
-
Medium risk
-
Low risk
-
-
Select the status of the signals shown in the matrix (4):
-
Unassigned to investigation: Signals that are not assigned to an investigation.
-
Assigned to investigation: Signals that are assigned to an investigation.
-
Meaning of the Data Displayed
| Data | Description |
|---|---|
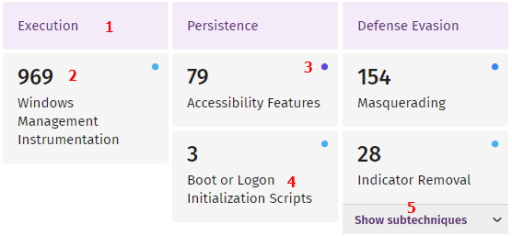
|
(1) |
MITRE technique |
|
(2) |
Number of signals found with the specified tactic and technique. |
|
(3) |
Risk associated with the tactic and technique used for the grouped signals. |
|
(4) |
MITRE tactic |
|
(5) |
Drop-down list that shows the sub-techniques used. For each sub-technique, the number of signals that have that sub-technique assigned is shown. Not all signals have a sub-technique assigned. |
View the Signals Mapped to a Tactic and Technique
Click the box for the relevant technique (2) or sub-technique (5). The Signals page opens, and shows the list of signals associated with the selected technique or sub-technique.