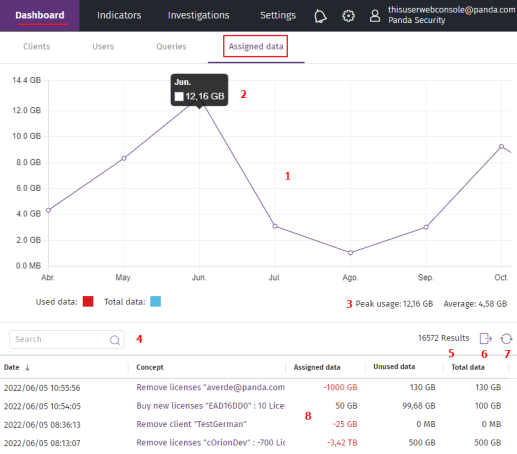
Assigned Data Dashboard
This dashboard shows a history of changes to the amount of data assigned to the MSSP in the last year.
Because Cytomic Orion assigns MSSPs 5 GB of data for each managed computer, if there is a change in the number of managed computers, the total amount of data is adjusted accordingly.
Required Permissions
The user account requires the View the data usage dashboard permission to access the dashboard content.
Access the Dashboard
-
In the top menu, select Dashboard. In the side panel, select Data usage.
-
Select the Assigned data tab.
Assigned Data History
The dashboard contains these items:

-
Line graph (1): Shows the trend of data assigned to the MSSP and data used.
-
Tooltip (2): Point the mouse to the points in the line graph. A tooptip appears that shows the content of the corresponding X and Y coordinates.
-
Usage statistics (3): Shows peak usage and the maximum volume of data recommended by Cytomic for the selected period.
-
Search (4): Filters the list of logged operations by the content of the Concept column.
-
Results (5): Number of changes to the assigned data.
-
Export: Downloads an Excel file with the content of the list (8).
-
Refresh (7): Updates the content of the list (8).
-
List (8): Logs the changes made to the amount of assigned data in the last year.
| Attribute | Description |
|---|---|
|
Date |
Date of the change in the amount of assigned data. |
|
Concept |
Type of logged change:
|
|
Assigned data |
Increase or decrease in the amount of data assigned to the MSSP, based on the logged change. |
|
Unused data |
The amount of data assigned minus the amount of data used at the time the change in the amount of data was logged. |
|
Total data |
Total data assigned to the MSSP after the logged operation. |