Investigations and Incidents Dashboard
This dashboard shows the incidents and signals detected, the status of investigations in progress, and the computers and clients most likely to fall victim to a cyberattack.
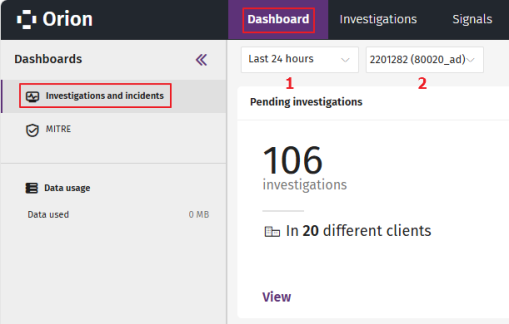
To access the Investigations and incidents dashboard:
-
In the top menu, select Dashboard.
-
In the side menu, select Investigations and incidents. A page opens that shows the dashboard tiles.
-
From the drop-down list (1), select a time period for the data shown in the tiles.
-
From the drop-down list (2), select a client, or All clients, to show the corresponding data in the tiles.
The Investigations and incidents dashboard has these tiles:
Pending Investigations
This tile shows the total number of pending investigations and the number of clients with at least one investigation pending.
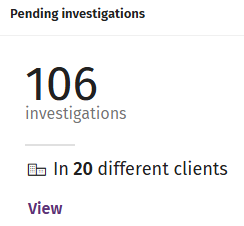
Click View to open the list of investigations filtered by Status = Pending. For more information, see Investigations list..
Investigations in Progress
This tile shows the total number of investigations in progress and the number of clients with at least one investigation in progress.
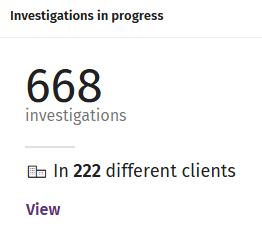
Click View to open the list of investigations filtered by Status = In progress. For more information, see Investigations list..
Open Investigations by Risk
This tile shows the total number of investigations pending and in progress grouped by risk category.
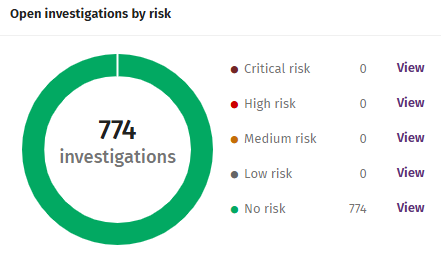
Click View to open the list of investigations filtered by Status = Pending and Status = In Progress and Risk = Selected risk. For more information, see Investigations list..
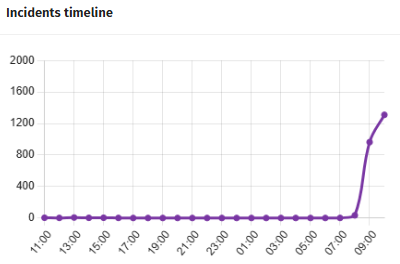
Incidents Timeline
This tile shows the trend in the creation of incidents.
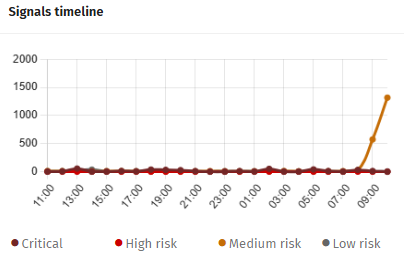
Signals Timeline
This tile shows the trend in the creation of signals.
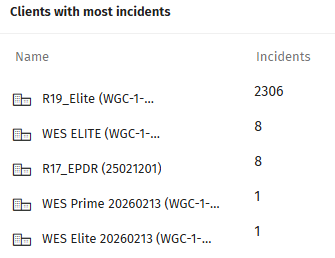
Clients with Most Incidents
This tile shows the five clients with most incidents.
Click View to open the Investigations list filtered by Clients = Selected client. For more information, see Investigations list..
Meaning of the Columns Displayed
| Name | Description |
|---|---|
|
Name |
Client name and ID. |
|
Incidents |
Number of incidents on the client’s network. |
| Columns in the Clients with Most Incidents tile | |
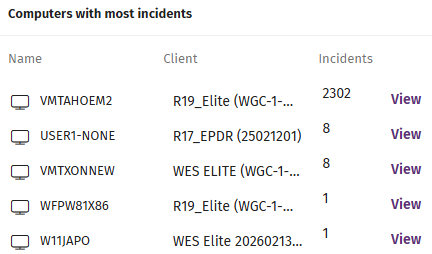
Computers with Most Incidents
This tile shows the five computers with most incidents.
Click View to open the Investigations list corresponding to clients whose Entities of interest panel contains the selected computer. For more information, see Investigations list and Manage Investigations
Meaning of the Columns Displayed
| Name | Description |
|---|---|
|
Name |
Name of the computer. |
|
Client |
Name of the client to whom the computer belongs. |
|
Incidents |
Number of incidents created on the computer. |
| Columns in the Computers with Most Incidents tile | |
Signals with Highest Risk
This tile shows the ten signals with the highest risk.
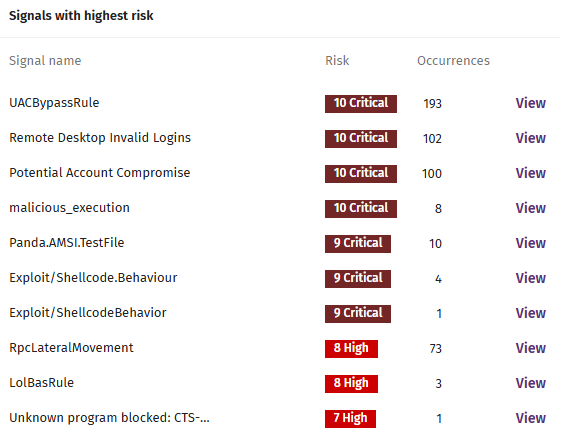
Click View to open the list of signals filtered by the selected signal. For more information, see Signals List.
Meaning of the Columns Displayed
| Name | Description |
|---|---|
|
Signal name |
Name of the signal detected on the computer. |
|
Risk |
Risk level assigned to the signal. |
|
Occurrences |
Number of times the signal was detected on the computer. |
| Columns in the Signals with Highest Risk tile | |