Investigation section (5)
This section shows the telemetry collected for the computer so you can investigate the source and scope of attacks.
For more information about the meaning of the fields in the telemetry data, see Format of the events contained in telemetry data.
You can use these tools to view the telemetry:
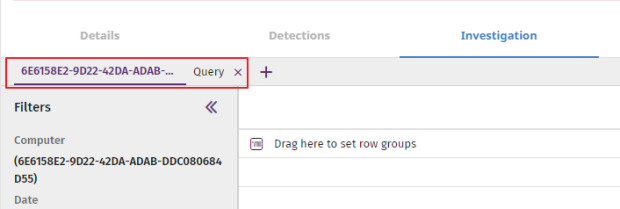
You can use one or more tools. The tab bar shows the tools used in the session. When you select the Investigation tab, the console automatically opens the Investigation console tool for the managed computer. To use another tool, select the relevant tab. To add a tool, click the ![]() icon.
icon.
Required permissions
| Permission | Access type |
|---|---|
|
Access Advanced Telemetry |
Access to the Investigation section. |
Investigation console
The Cytomic Orion investigation console shows a list of all events logged on the computer over a one-day period. You can change the start date to up to seven days earlier to see telemetry recorded in previous days.
For more information about the Cytomic Orion investigation console, see Investigation Console Structure.
Opening a new investigation console
As your investigation progresses, you might need to open more investigation consoles for other computers on the networkDatabase schema
To open a new investigation console:
-
Select the Investigation tab for the selected computer. The Cytomic Orion console opens.
-
Click the
 icon. The context menu opens.
 -
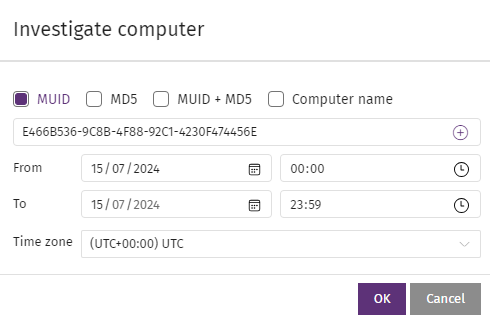
Select Computer investigation. The Investigate computer dialog box opens.
-
To investigate all events logged on a computer over a one-day period:
-
Select MUID or Computer name (the advanced SQL query tool works with MUIDs. See Device ID (MUID)).
-
In the text box, type the Computer name or MUID.
-
Select the time period for which the investigation console will retrieve data from the data lake. You can change the start date to up to seven days earlier to see telemetry recorded in previous days. The longest supported time period is one day.
-
Select a time zone for the time period.
-
Click OK. A new tab appears that shows the investigation console configured to show telemetry for the selected computer.
-
-
To investigate a file when you do not know the computer that contains it:
-
Select MD5. In the text box, enter the file MD5.
-
Click OK. A new tab opens that shows the investigation console. The investigation console has two panes.
-
From the left pane, select the computer you want to investigate. The right pane shows all events related to the file on the computer.
-
-
To investigate a file when you know the computer that contains it:
-
Select MUID + MD5. In the text boxes, type the computer MUID and the file MD5.
-
Click OK. The investigation console opens and shows all events related to the file on the computer.
-
Advanced SQL queries
You can navigate the data lake to find specific events for a selected computer or any other computer on the managed network using the computer MUID. With the advanced SQL query tool, you can access telemetry recorded on the current day, as well as the seven previous days. To do this, you must use SQL and know the database schema used. See Database schema
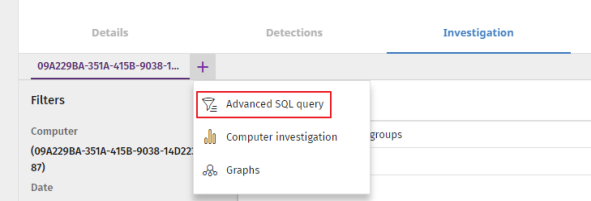
To access the advanced SQL query tool:
-
Select the Investigation tab for the selected computer. The Cytomic Orion investigation console opens.
-
Click the
 icon. The context menu opens.
 -
Select Advanced SQL query. The advanced SQL query tool opens.
For more information about how to use the advanced SQL query tool, see Advanced SQL Query Module.
Some features of the advanced SQL query tool are only available to customers who access the tool directly through the Cytomic Orion console.
For more information about the syntax of the SQL type used in Cytomic Orion, see Advanced Query Module SQL Syntax.
Database schema
When you access the advanced SQL query tool from Advanced EDR, the events logged on the computer are stored in two tables:
-
Telemetry: Stores the telemetry logged on computers.
-
Indicators: Shows the indicators logged on computers. Indicators are grouped. For more information about the grouping algorithm, see Indicator Grouping.
The EventType field in the Telemetry table indicates the type of event stored in the corresponding row. For more information about the types of events, see Format of the events contained in telemetry data.
Device ID (MUID)
The advanced SQL query tool shows events from the data lake just as they are stored in the database. Some tables store references to computers on the network by using the computer MUID (Machine Universal Identifier). To get a computer name from the computer MUID, search for the MUID in the Advanced EDR console. See Computers.
Graphs
Graphs use nodes and arrows to provide a graphical representation of the processes discovered in your analysis and the relationship between them. The information shown on a graph is equivalent to the information shown in the investigation console or in advanced queries, but organized and presented in a clearer, easier-to-interpret way.
Opening a graph
-
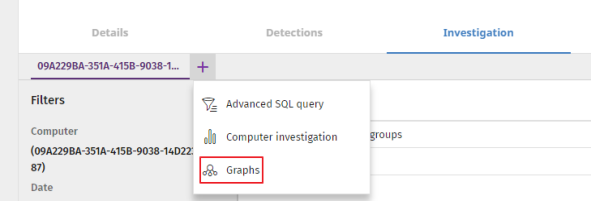
Select the Investigation tab for the selected computer. The Cytomic Orion investigation console opens.
-
Click the
icon. The context menu opens. -
Select Graphs. The New graphical investigation dialog box opens and shows a list of all graph templates defined.
-
Select a template based on the type of data you want the graph to show. For more information about the available templates, see Information Contained in Graphs. If the template requires parameters, a dialog box opens for you to enter the necessary information.
For more information about graphs, see Graphs.