Investigation Console Structure
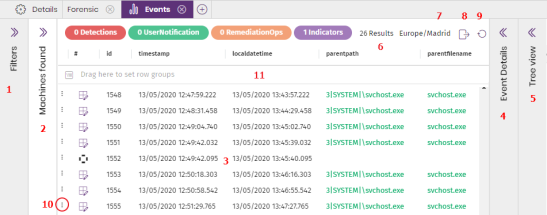
The investigation console is divided into multiple panels, depending on how you access it:
-
Filters left panel (1): Set filters and configure the way data is presented in the central and right panels to meet your needs.
-
Found computers side panel (2): If you started the investigation from a file MD5 (see File Investigation: MD5), a panel appears that shows a list of computers where events related to the specified file were found.
-
Central panel (3): Shows a list of events found on the selected date and, optionally, a timeline.
-
Event details right panel (4): Shows fields for the event selected in the central panel
-
Process tree panel (5): Shows the parent-child hierarchy of all the processes and items logged on the specified date.
-
Number of results (6)
-
Date (7): Set the time zone for the dates shown in the event list (3).
-
Export list (8): Downloads the list of events in CSV format to the analyst computer.
-
Refresh list (9)
-
Context menu (10): Shows the actions analysts can take on the event.
-
Show computer events
-
Show computers with parent file
-
Show computers with child file
-
Execute notebook with parameters
-
Add entities of interest
-
Computer details
-
-
Tools for configuring the list (11): For more information about how to group the data in the list by columns and other resources for configuring how the event list is shown, see List Configuration Tools.