Risk assessment module panels/widgets
Accessing the dashboard
From the top menu, select Status. From the side menu, select Risks.
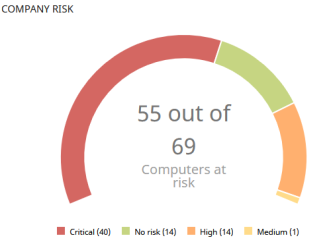
Company risk
This widget shows the number and percentage of computers on the network with an assigned risk level. The status of computers is indicated by a circle with various colors and associated counters.
At the bottom of the widget, a message appears that shows the number of exclusions that are not considered a risk, if any, based on the exclusion impact settings. When you click the message, the Manage exclusion impact dialog box opens. See Managing exclusions
Meaning of the data displayed
| Data | Description |
|---|---|
|
Critical |
Number of computers with a critical risk level. |
|
High |
Number of computers with a high risk level. |
|
Medium |
Number of computers with a medium risk level. |
|
No risk |
Number of computers that are not at risk. |
|
Central area |
Sum of all computers with an assigned risk level. |
Lists accessible from the panel
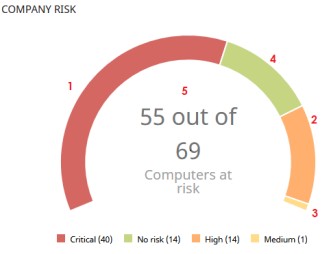
Click the hotspots shown in Hotspots in the Company Risk panel to open the Risks by computer list with these predefined filters:
| Hotspot | Filter |
|---|---|
|
(1) |
Risk = High |
|
(2) |
Risk = Critical |
|
(3) |
Risk = No risk |
|
(4) |
Risk = Medium |
|
(5) |
No filters |
Risks trend
This widget shows the number and types of risks that are detected over time.
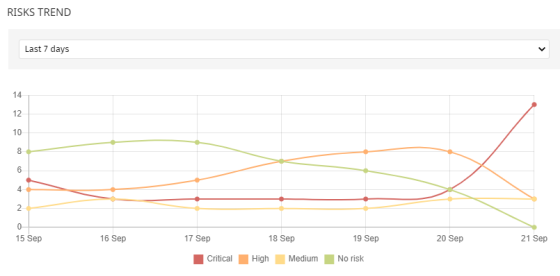
Meaning of the data displayed
| Data | Description |
|---|---|
|
Critical risk |
Trend of the number of computers with a critical risk level. |
|
High risk |
Trend of the number of computers with a high risk level. |
|
Medium risk |
Trend of the number of computers with a medium risk level. |
|
No risk |
Trend of the number of computers that have no risks. |
Point the mouse to a node on the graph to show a label with this information:
-
Date
-
Risk level
-
Number of affected computers
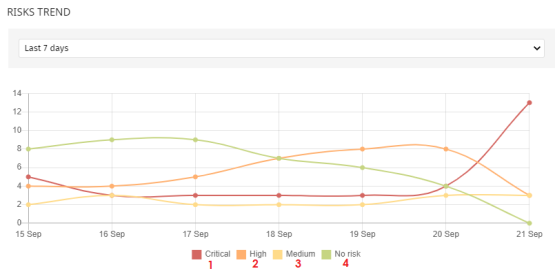
Lists accessible from the panel
Click the legend items under the graph to open the Risks by computer list filtered to show the selected item. To open the Risks by computer full list with no filters applied, click an empty space on the graph.
| Hotspot | Filter |
|---|---|
|
(1) |
Risk = Critical |
|
(2) |
Risk = High |
|
(3) |
Risk = Medium |
|
(4) |
No risks |
Detected risks
This widget shows the most commonly found risks on computers.
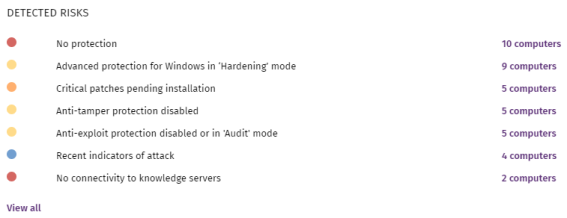
Meaning of the data displayed
| Data | Description |
|---|---|
|
Icon |
Risk level defined by you.
|
|
Name |
Risk name. |
|
Number |
Number of computers where the risk was detected. |
|
View all |
Link to the full list of all of the risks detected. |
Lists accessible from the panel
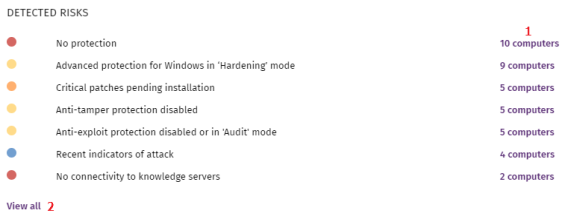
Click the hotspots shown in the figure to open these lists with these predefined filters:
| Hotspot | List | Filter |
|---|---|---|
|
(3) |
Risks by computer |
Detected risk = Risk selected on the widget |
|
(4) |
Risks |
No filters |
Top 10 computers at risk
This widget shows the ten computers with the highest overall risk level.
![]()
A computer overall risk level is the highest risk level of the risk factors detected on the computer. For more information, see Calculation of the overall risk level for a specific computer.
Meaning of the data displayed
| Data | Description |
|---|---|
|
Name |
Computer or device name and type. |
|
Color bar |
Type of risks found and the total number of risks. |
|
Risk level |
Overall risk level assigned to the computer. |
|
View all link |
Access to the Risks by Computer full list. |
Lists accessible from the panel
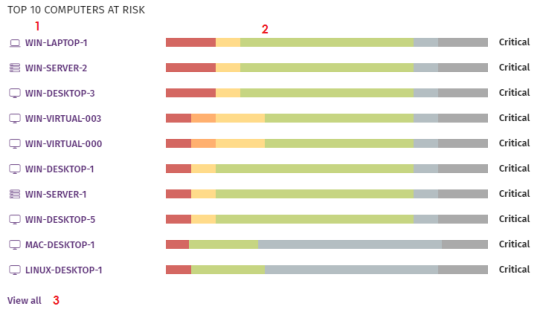
Click the hotspots shown in the figure to open these lists with these predefined filters:
| Hotspot | List | Filter |
|---|---|---|
|
(1) |
Computer details |
|
|
(2) |
Risks |
Computer selected on the widget. |
|
(3) |
Risks by computer |
No filters |
You can also review information on the status of the risks detected on a computer on the Computer details page. For more information, see Computer details.