Incident Details
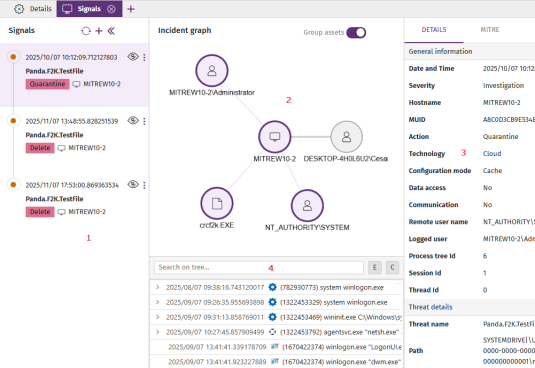
The details page for an incident is divided into these panels:
-
Left panel - Signals (1): List of signals included in the incident in chronological order based on when they were logged.
-
Central panel - Incident graph (2): Diagram of the assets involved in the signals associated with the incident.
-
Right panel (3): Details of the item you select in the left panel: incident, signal, MITRE TTP (tactic, technique. and procedure), or entity of interest.
-
Lower panel - Process tree (4): Sequence of events that generated the signal, in chronological order.
To manage an incident:
-
To view information about the incident, see View the Details of an Incident.
-
To view information about the entities of interest related to the incident, see View the Details of an Entity of Interest.
-
To manage signals included in an incident, see Manage Signals from the Incident Details Page.
View the Details of an Incident
-
Make sure there are no hidden signals in the left panel. To show hidden signals, click the
 icon. The central panel updates to show all assets related to the incident.
 -
Make sure no signal is selected in the left panel. To clear the selection, click the signal. The right panel updates to show information about the incident.
-
To view general information about the incident, in the right panel, select the Details tab. The tab includes these fields:
-
Account: Client account ID.
-
Created: Date and time when Cytomic Orion created the incident.
-
MITRE: TTPs associated with the incident signals. Point to a TTP to show the name of the relevant tactic or technique.
-
-
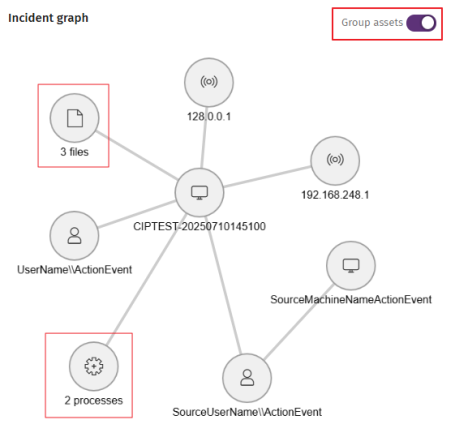
To simplify the graph, enable the Group assets toggle to group affected assets of the same type in a circle The number of assets in the group shows below the circle (for example, 3 files, 2 processes).
-
-
Assets that could show in the incident graph include:
Icon Description 
Logged-in user
Remote user

Computer
Remote computer

Process

IP address

File
View the Details of an Entity of Interest
Entities of interest contain information related to the signals detected by Cytomic Orion.
To view the list of entities of interest related to an incident:
-
Make sure there are no hidden signals in the left panel. To show hidden signals, click the
icon. The central panel updates to show all assets related to the incident. -
Make sure no signal is selected in the left panel. To clear the selection, click the signal. The right panel updates to show information about the incident.
-
Select Entities of Interest. See Types of Entities of Interest.
-
To run a remediation tool, see Run Investigation or Remediation Tools.
-
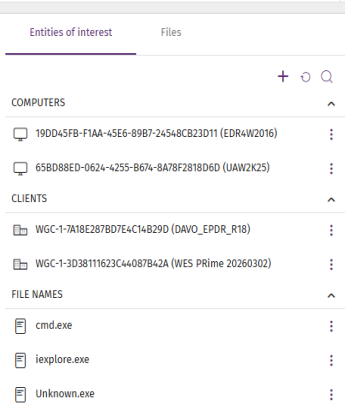
Types of Entities of Interest
-
Computer
: The computer MUID. Computers without a valid license ( active or in grace period) appear in red. -
Client
 : The name and identifier of the client to which the investigated computer belongs. If the account you use to access the web console does not have sufficient permissions, only the identifier is shown.
 -
User
 : The user account that ran the program that caused the signal.
 -
File hash
 : The file digital fingerprint.
 -
IP address
 : The computer IP address.
 -
Port
 : The port on which the process that generated the signal on the computer ran.
 -
Domain
 : The domain for a communication made to or from the computer.
 -
URL
 : A web address accessed from the computer.
 -
File path
: The location of a file in the computer file system. -
File name
: The name of a file on the computer.
Run Investigation or Remediation Tools
-
If it is collapsed, click the header of the Computers section to show the entities it contains.
-
Click the
icon for the entity that you want to investigate. A context menu opens.
-
Select an investigation or remediation tool:
-
Investigate computer
 : Review the events logged in the investigation console. For more information, see Analyses Using the Investigation Console.
 -
Automated investigation
 : Use a notebook to analyze the signals detected on the computer. For more information, see Investigations with Notebooks.
 -
Assisted investigation
: Open a wizard to start an assisted investigation. For more information, see Assisted Investigations. -
Isolate computer
 : Block all communications to and from the computer. For more information, see Isolate Computers.
 -
Stop isolating computer
 : Restores all communications on the computer. For more information, see Isolate Computers.
 -
Remote access to computer
 : Remotely run commands on the computer. For more information, see Remote Command Line.
 -
Restart computer
 : Remotely restart the computer. For more information, see Restart Computer.
 -
Computer details
 : Review information about the computer. For more information, see Computer Details
-