Central Panel
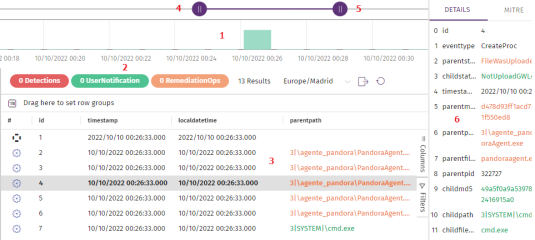
This panel shows the list of events that corresponds to the computer and date you specify in the side panel (Computer and Date fields). The central panel is divided into three areas:
-
Bar graph (1): Graphically shows the number of events in five-minute intervals. A large number of events in a short period of time could indicate activity related to an attack. See Bar Graph.
-
Events panel information bar (2): Indicates the subset of events shown in the graph over the total number of events logged on the investigated computer on the specified day. See Information Bar.
-
Events sub-panel (3): Shows the events monitored and collected by Cytomic Orion on the investigated computer on the specified day,
For more information about how to interpret and use the date-type fields in events, see Meaning of Date-type Fields.
Bar Graph
This graph shows the number of events occurred per unit of time on the Y axis, and the time stamp in hour:minutes format on the X axis. Move your mouse cursor over the graph to see the number of events logged at the relevant time.
After you select a date in the side panel, you can change the time interval to focus on the activity logged at a specific time or change the interval shown. To do this, use the buttons (5) in the top bar (4), or the time configuration settings (1).
Top Bar (4)
Click the center of the bar and drag it left or right to change the interval for the activity shown in the graph.
Top Bar Buttons (5)
Click the buttons in the top bar and drag them left or right to change the time range for the activity shown in the graph
Details Panel (6)
Select an event in the list (3) to open the Details and MITRE panel. For more information, see Details and MITRE Side Panel.
Bar Graph (1)
Click anywhere in the graph and drag your mouse cursor to define a new window to view the activity. The graph updates with a new zoom level and a new time period for the data shown.
Information Bar

-
(1) Color labels that show the number of found events. Click a label to open a floating panel that shows the events of the selected type. Click an event. The panel hides and the event appears selected in the events sub-panel. The available types of events are these:
-
Detections: Threat detection events generated by the security software installed on the workstation or server.
-
UserNotification: Events that involved showing a pop-up window to the user, prompting for an action that could affect the security of the computer.
-
RemediationOps: Events that involved the security software installed on the computer taking action.
-
Indicators: Generated indicators.
-
For a description of the fields in each event type, see Format of the Events Used in Cytomic Orion.
-
(2) Number of entries shown in the events sub-panel.
-
(3) Time zone: Set a time zone for the events shown.
-
(4) Export: Download a file in CSV format that contains the list of events.
-
(5) Refresh: Requests the list from the server and updates the events shown.
Events Sub-panel
This panel shows the events monitored on the computer and collected by Cytomic Orion. The information appears in a table that provides access to the filtering, sorting, and search tools described in Tools for Configuring Lists.
With particularly long lists, the panel shows the first 150,000 events that occurred in the selected time period. In such case, the message Showing the first 150,000 events for the selected time range appears. To show events that might have been lost, configure a new time range.
The events sub-panel consists of a number of columns that describe each event. The first column shows an icon that represents the type of event logged.
| Icon | Description | Icon | Description |
|---|---|---|---|
|
|
Process created |
|
Executable file created |
|
|
Executable file edited |
|
Library loaded |
|
|
Executable program deleted |
|
Executable file edited |
|
|
Directory created |
|
Compressed file created |
|
|
Compressed file opened |
|
Registry entry created that points to an executable file |
|
|
Registry entry edited that points to an executable file |
|
Remote process thread created |
|
|
Exploit detected |
|
Unclassified event |
|
|
File downloaded |
|
Network operation |
|
|
Unknown process that was not blocked because there is no interactive session on the computer |
|
Document opened |
|
|
Registry operation |
|
Script file created |
|
|
Script file run |
|
Threat detected |
|
|
Size of data transmitted over the network |
|
WMI event logged by SYSMON which modifies the computer operating system settings |
|
|
Failed DNS resolution |
|
Device control operation |
|
|
The agent showed a pop-up message on the user computer |
|
Start of an interactive session on the computer |
|
|
End of an interactive session on the computer |
|
Action taken by the security software installed on the computer |
|
|
Internal administrative event |
|
Computer restart |
|
|
Operation performed by an executable file whose creation was not logged |
|
The security software detected an executable file whose creation was not logged either because of a temporary problem or because the file existed before the security software was installed |
|
|
Remote process created |
||
When you right-click an event or the corresponding icon, a context menu opens and shows these options:
-
Show computer events: Opens a new tab that shows the events logged on the computer.
-
Show computers with parent file: Opens a new tab in the investigation console that shows a list of computers where events were logged that involved the event parent file.
-
Show computers with child file: Opens a new tab in the investigation console that shows a list of computers where events were logged that involved the event child file.
-
Execute notebook with parameters: Opens a new tab with a notebook. See Access and Create Notebooks .
-
Add entities of interest: Adds an entity of interest to the investigation. See Entities of Interest Panel.
-
Computer details: Shows basic information about the hardware and Cytomic security software installed on the computer. See Computer Details.
Details and MITRE Side Panel
When you select an event, a side panel opens that shows two tabs: Details and MITRE. This panel contains all the telemetry collected for the event and information from MITRE regarding the associated tactics and techniques.
-
For more information about the meaning of the fields on the Details tab, see chapter Format of the Events Used in Cytomic Orion.
-
For more information about the data on the MITRE tab, see Details Panel
Show AMSI (AntiMalware Scan Interface) Buffer
SystemOps events can store the content of the AMSI buffer with the script that generated the event. To show the AMSI buffer:
-
In the events sub-panel, select a SystemOps event. The event fields appear in the Event details side panel.
-
Click the View script link. A dialog box opens that shows the content of the stored script.
-
To copy the script to the clipboard, click Copy.
-
To download the script to the analyst computer, click Download.
Show Static Information for the File Associated with an Event
Cytomic Orion can show static data for a binary file if the data was previously sent to Cytomic servers. Files are automatically sent as part of the typical scanning and classification processes performed by the security software installed on the user computer.
Sometimes, the Cytomic server has the files requested by the analyst, but the scan has not started or finished. In this case, the console shows a message that prompts the analyst to retry the operation a few minutes later.
To show static information for a file:
-
Select an event associated with a binary file (for example, a CreateProc event). The event fields appear in the Event details side panel.
-
If Cytomic Orion can access static information for the file, it shows the Show static information section associated with the parent process and the child process.
-
Click Show static information. A tab opens that shows these sections:
-
File capabilities: Technique, tactic, and description of the file features.
-
Strings: Character strings found in the file.
-
Sections: Shows the different sections in the binary file. For more information, see https://learn.microsoft.com/en-us/archive/msdn-magazine/2002/february/inside-windows-win32-portable-executable-file-format-in-detail and https://learn.microsoft.com/en-us/archive/msdn-magazine/2002/march/inside-windows-an-in-depth-look-into-the-win32-portable-executable-file-format-part-2.
-
Imports: Functions the file imports to be able to run.
-
Exports: Functions the file exports.
-
Process Tree Panel
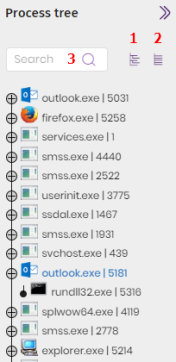
This tree shows the hierarchy of all the processes run on the computer. For each notebook, this information appears:
-
Process icon.
-
Name of the executable file that generated the process in memory.
-
Process ID (PID).
The process tree enables you to take these actions:
-
To show the child processes of a process, click the
icon.
-
To find an event associated with a process, select the process in the process tree. Click the event. The event appears selected in the events sub-panel.
-
To collapse or expand the tree branches, click the (1) and (2) icons.
-
To filter the process tree, use the text box (3). The tree shows only the processes that contain part of or the complete string you specify.