Manage Investigations
Investigations store the evidence found while you analyze signals and incidents.
All signals and incidents included in an investigation are associated with entities of interest such as computers, files, and users. See Manage Entities of Interest.
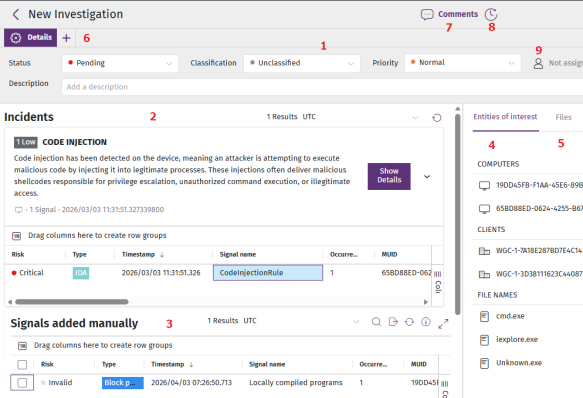
The page for an investigation is divided into panels:
-
Investigation attributes (1)
-
Incidents (2)
-
Signals (3)
-
Entities of interest (4)
-
Files (5)
-
Analysis tools (6)
-
Comments and notes (7)
-
Activity log with a change history (8)
-
User assigned to the investigation (9)
From the Investigations page, you can:
Assign Investigations to User Accounts
-
In the top menu, select Investigations. The Investigations list opens.
-
To filter and find the investigation you want to manage, see Investigations list.
-
Select an investigation. A page opens that shows the investigation details.
-
To assign an investigation to a Cytomic Orion user:
-
Click the user account
 (9). A drop-down list opens.
 -
Select a user account.
-
Change the Attributes of Investigations
![]()
-
From the top menu, select Investigations. The Investigations list opens.
-
To filter and find the investigation you want to manage, see Investigations list.
-
Select an investigation. A page opens that shows the investigation details.
-
To rename the investigation:
-
Click the investigation name (1).
-
Type a new name.
-
Press Enter or click outside the investigation name.
-
-
To change the investigation status:
-
Click Status (2). A drop-down list opens.
-
Select a new status (Pending, In progress, Closed). Closed investigation do not receive any more incidents that affect the computer. In this case, Cytomic Orion automatically creates a new investigation with a Pending status.
-
-
To change the investigation classification:
-
Click Classification (3). A drop-down list opens.
-
Select a new classification (Unclassified, Confirmed attack, Investigation without detected attacks, Potential attack).
-
-
To change the investigation priority:
-
Click Priority (4). A drop-down list opens.
-
Select a new priority (Critical, High, Normal, Low).
-
-
In the Description text box (5), add or edit a description for the investigation.
Manage Comments
-
Click Comments.
 (7). The Comments panel opens and shows a list of all comments written by analysts.
 -
To add a comment:
-
Use the formatting bar to format your comment text. See Formatting Toolbar.
-
In the text box, enter a comment. Click Save.
-
-
To close the panel, click the
 icon.
icon.
Formatting Toolbar
Format your comment text or add external resources.
| Field | Description |
|---|---|
|
|
Bold |
|
|
Italics |
|
|
Strikethrough |
|
|
Underline |
|
|
Code segment |
|
|
Heading 1 |
|
|
Heading 2 |
|
|
Heading 3 |
|
|
Bulleted list |
|
|
Numbered list |
|
|
To add a URL:
|
|
|
Remove link |
|
|
To add an image:
|
Run Analysis Tools
-
In the top menu, select Investigations. The Investigations list opens.
-
To filter and find the investigation you want to manage, see Investigations list.
-
Select an investigation. A page opens that shows the investigation details.
-
In the tab menu, click the
icon. A drop-down menu opens.
-
Select an analysis tool:
-
Advanced SQL query
 : Explore the investigation telemetry through SQL statements. See Advanced SQL Query Module.
 -
Wizard-guided queries : Explore the telemetry generated by signals and incidents through a wizard that facilitates the creation of SQL statements. See Wizard-guided Queries Module.
-
OSQuery query
 : Get information about the hardware and software installed on the computer where the signal was detected. See IT Infrastructure Investigation with OSQuery.
 -
Investigate computer
 : Opens the investigation console and shows the events included in the signal. See Analyses Using the Investigation Console.
 -
Manual investigation
 : Opens a notebook to investigate the signal. See Investigations with Notebooks.
 -
Automated investigation
: Opens the investigation wizard. See Assisted Investigations. -
Graphs : Shows the telemetry associated with the investigation in the form of a graph. See Graphs.
-
Ask GenAI Assistant
 : Query the investigation telemetry with natural language. See Analyze Investigation Telemetry with Natural Language.
-